Energy management
How a warming climate changes electricity planning
Heating and cooling degree-day trends show how a changing climate is entering utility load forecasts.
Originally published on LinkedIn. This article reflects the information and perspective at the time of the original post.
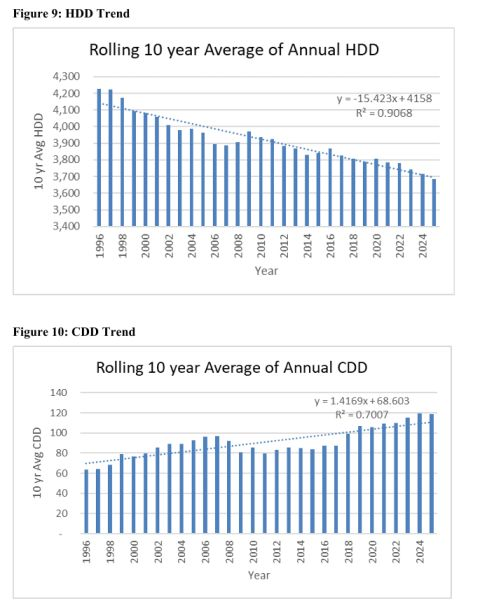
Buried in Nova Scotia Power's 2026 10-Year Load Forecast is a striking picture of climate change in our own backyard. Heating Degree Days (HDD) and Cooling Degree Days (CDD) measure how far the daily temperature falls below or rises above 18°C, the point where we typically start heating or cooling our buildings. They're directly correlated to the amount of energy it takes every year to heat and cool our homes and buildings.
NSP's regression of 30 years of Halifax-area weather data (Shearwater Airport) shows: 🌡️ HDD declining by ~15 per year; CDD rising by ~1.4 per year 🔻 By 2036, annual HDD falls to 3,561, a further ~2% decline, and roughly 16% below 1996 levels 🔺 By 2036, annual CDD climbs to 141, about 20% higher than today, and more than double the 1996 level
In other words: less heating energy, more cooling energy. Heating demand still dwarfs cooling demand in Nova Scotia (3,500+ HDD vs ~140 CDD), but the direction is unmistakable, and our utility is now baking a warming climate directly into its load forecasts.
Climate change isn't an abstraction. It's a line item in how we plan our grid.