Policy & regulation
What Nova Scotia’s 10-year electricity outlook tells us
A planning snapshot outlines major generation changes while the next Integrated Resource Plan takes shape.
Originally published on LinkedIn. This article reflects the information and perspective at the time of the original post.
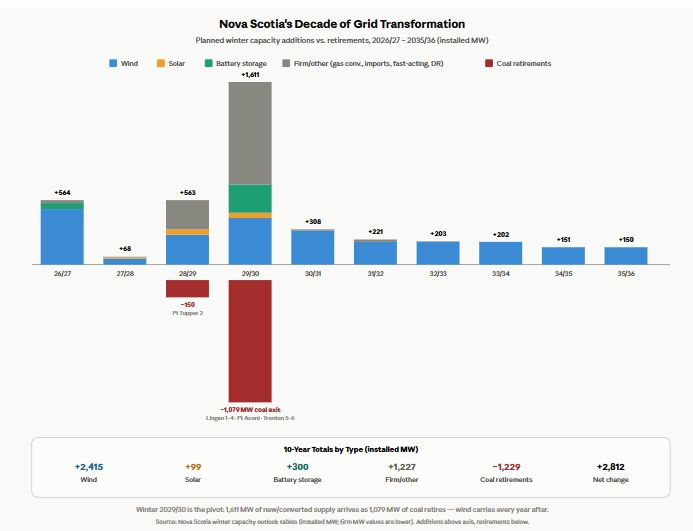
IESO Nova Scotia recently published its 10-year System Outlook for the province's grid, its first since taking over this planning function from Nova Scotia Power. The chart below shows generation additions and retirements by type and year over the next decade. The plan calls for a coal-free grid by 2030, with 2,415 MW of new onshore wind added by 2035 (the province's existing wind capacity is 645 MW for reference).
It also adds 300 MW of new energy storage by 2030, including the recently completed 50 MW Whiterock battery installation from NSP which will bring total energy storage to 400 MW. Net metering and distributed energy resources aren't shown in this chart, but substantial growth is expected over the next 10 years.
The recently released Distributed Energy Resources Integration Roadmap (DERIR), found here: https://lnkd.in/gZsKJh3K (opens in a new tab) is a first step toward laying the groundwork for that additional DER uptake.
Notably, this outlook is a snapshot, not the final word. The development of the next Integrated Resource Plan (IRP) is currently underway, and it will shape future decisions about what gets procured, when, and in what mix, including how much of the later-decade wind procurement proceeds as planned, and whether additional storage, imports, or firm capacity take a larger role.
The years beyond 2030 in this chart are best read as placeholders for decisions the IRP process is still working through.