Energy management
The boom and bust of home energy audits in Canada
EnerGuide data illustrates the waves of activity associated with federal retrofit programs and the case for more stable financing.
Originally published on LinkedIn. This article reflects the information and perspective at the time of the original post.
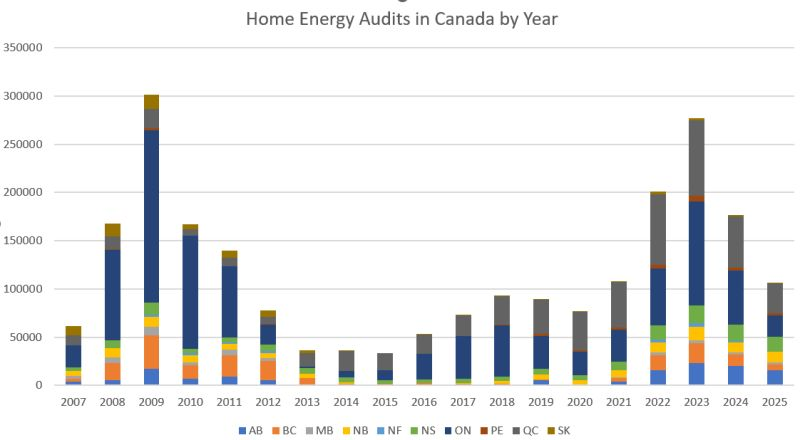
The chart above shows the number of EnerGuide Home Energy Audits in Canada by province per year dating back to 2007. The two big waves of demand are attributable to the 2007-2012 EcoENERGY Retrofit Program and the 2021-2025 Canada Greener Homes Program which has now ended. Nova Scotia is a Canadian Leader (only behind PEI) in Energy Audits per capita and a disproportionate beneficiary of these federal programs due to our strong energy efficiency industry.
During the peak year of Canada Greener Homes the Energy Audits per 100,000 population are shown in my original LinkedIn post. Prince Edward Island 3,224 Nova Scotia 1,728 New Brunswick 1,707 Ontario 687 Quebec 881 British Columbia 399 Alberta 486 Newfoundland & Labrador 669 Manitoba 208 Saskatchewan 154
I personally believe Canadian homeowners should have access to long-term, low-interest retrofit financing to help reduce future boom-and-bust cycles and maintain healthy levels of retrofit activity.
Note: The data is from Natural Resources Canada (NRCan) EnerGuide Open Data Portal https://lnkd.in/gmWpD2dF (opens in a new tab) I put this analysis together over my morning coffee by building a Python natural-language EnerGuide query tool with the help of Claude Code. The underlying dataset is incredibly rich, covering every home in Canada that has had an energy audit, and I’m looking forward to sharing more insights from it in the days ahead.