Solar
Nova Scotia’s solar growth during 2020
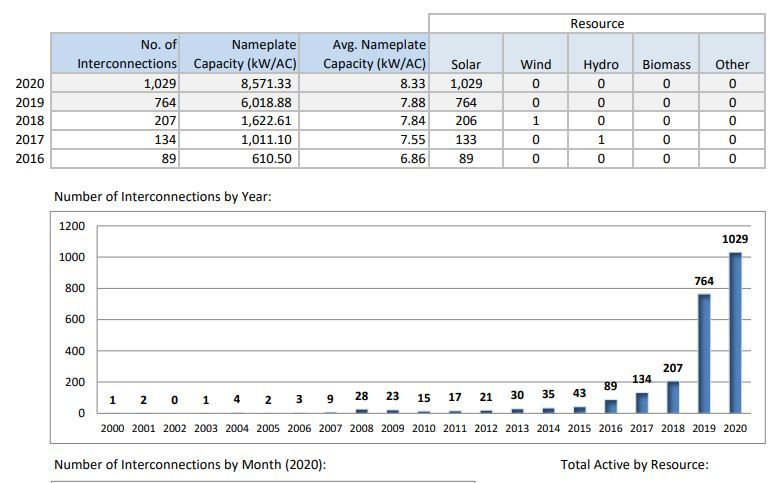
A historical interconnection table records continued growth during the pandemic.
Informational adaptation of the original LinkedIn post’s topic and available supporting material. The date shown is the original post date; wording reviewed September 2026.
The original post drew attention to solar development during the pandemic. The accompanying reporting table lists 1,029 interconnections in 2020, compared with 764 in 2019, and identifies all the 2020 additions shown as solar.
The table reports 8,571.33 kW AC of nameplate capacity for those 2020 additions, approximately 8.57 MW AC. That figure describes the year’s additions in this reporting set rather than total provincial solar capacity.
Keep the reporting boundary visible
Interconnection counts are not the same as electricity production, and AC capacity should not be silently compared with DC panel capacity. A provincial total can also include projects outside the scope of a particular interconnection report.
This snapshot records the growth described at the time of the original post. It is retained as part of the history of Nova Scotia’s solar market.