Electrification
Electric vehicle adoption across Canada
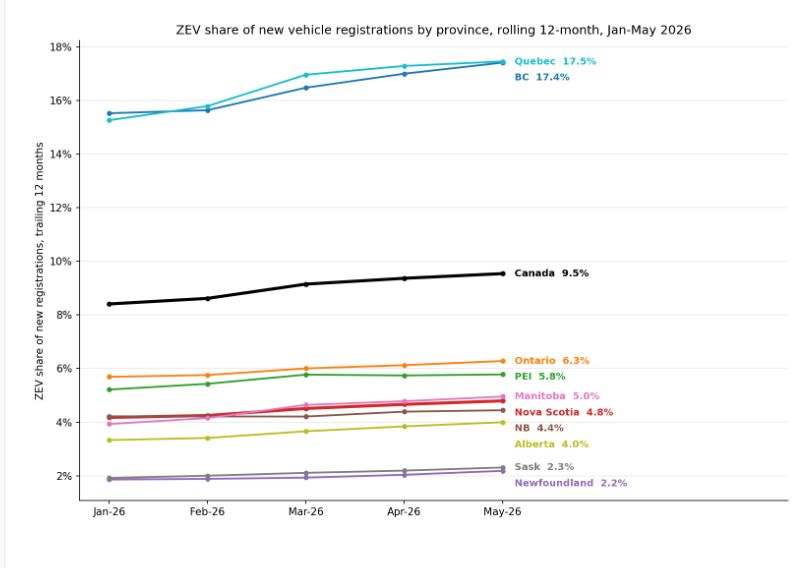
A rolling registration-share comparison shows the variation between provincial EV markets.
Adapted from David Brushett’s original LinkedIn commentary. The date shown is the original post date; wording reviewed September 2026.
The accompanying chart compares zero-emission vehicle adoption across provinces using rolling 12-month shares of new vehicle registrations. It shows the reporting points from January through May 2026.
Quebec and British Columbia lead the provinces shown. The chart labels the May reporting point at 9.5% nationally and 4.8% for Nova Scotia. Those figures describe this historical chart rather than current monthly sales.
New registrations and the vehicle fleet are different
A growing share of new registrations takes time to change the overall fleet. The distinction matters when considering charging demand, fuel consumption and the pace of transport electrification.
The original post discussed purchase incentives and fuel prices as factors that could influence demand. The chart alone does not establish how much any one factor caused the change.
For Nova Scotia, continued EV adoption makes charging access and managed charging increasingly relevant to electricity planning. The timing and location of charging matter alongside the number of vehicles.