Battery storage
Battery production growth and the cost outlook
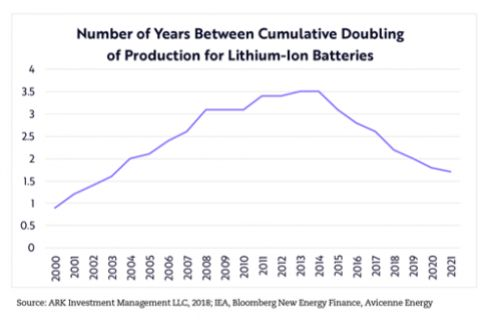
An archived production-growth chart provides context for expectations about battery costs.
Informational rewrite based on the topic and available supporting material from David Brushett’s original LinkedIn post. The date shown is the original post date; wording was reviewed in September 2026.
The chart shared with the original post tracks the number of years between cumulative production doublings for lithium-ion batteries. Shorter intervals indicate faster growth in cumulative output.
Production growth is not a price guarantee
Increasing production can create opportunities for manufacturing improvements and economies of scale. It does not establish a fixed timetable for price reductions: material costs, supply constraints, technology choices and market conditions also matter.
The original post’s cost outlook should therefore be read as a historical expectation. The supplied chart ends in 2021 and does not verify subsequent prices.
Compare complete systems
A battery cell or pack price is only part of an installed storage project. Power conversion, controls, enclosure, installation and grid-connection requirements affect the total cost.
For a building owner or utility, the useful comparison is the cost and performance of a complete system serving a defined need, including its usable energy, power capability and expected life.