Electrification
Atlantic Canada’s electrification progress
What the 2012–2023 sector comparison shows about the shift from fuels to electricity.
Adapted for PB Energy’s Insights archive from David Brushett’s LinkedIn commentary. The date shown is the original post date.
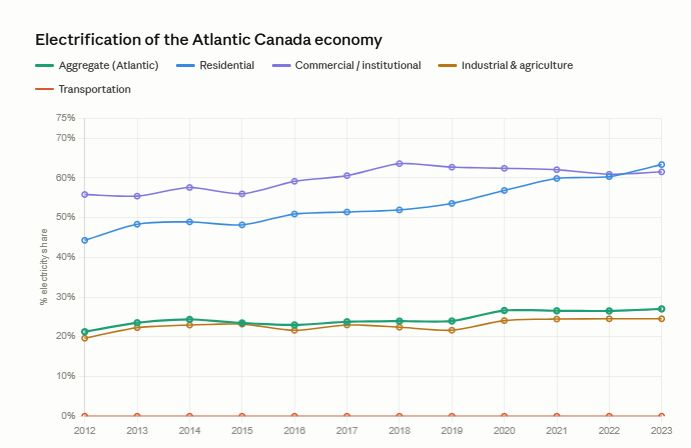
The accompanying chart tracks electricity’s share of energy use across Atlantic Canada’s economy from 2012 to 2023. In the original analysis, the regional share increased from approximately 21% to 27%, with residential and commercial uses already much more electrified than transportation.
This is a measure of the share of energy supplied by electricity. It is not the renewable share of electricity generation, nor the share of buildings or vehicles that use electric technology.
Different sectors have different starting points
Residential electrification reflects, in part, the shift from heating oil to heat pumps. The transportation line remained close to zero on the chart’s scale during the period shown; that should not be read as a claim that no electric vehicles were operating.
More electricity need not mean more total energy
Electric motors and heat pumps can deliver the same services with less energy input than combustion-based alternatives. As a result, electricity demand can grow while total energy use falls.
The regional opportunity is to connect fuel switching with efficient equipment, building improvements and managed demand. The chart provides a historical baseline for that discussion, rather than a statement of today’s adoption levels.